Q: Birth rates are dropping all over the world. Isn’t the “population bomb” really a dud?
Fertility rates have dropped to half of what they were in 1950: from an average of 5 offspring to 2.5.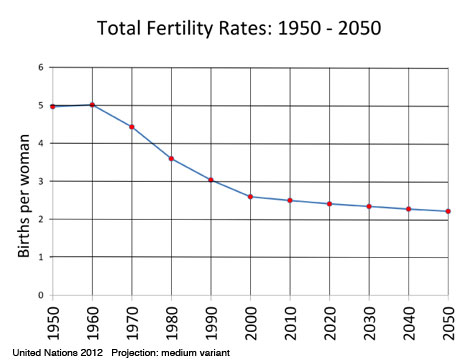
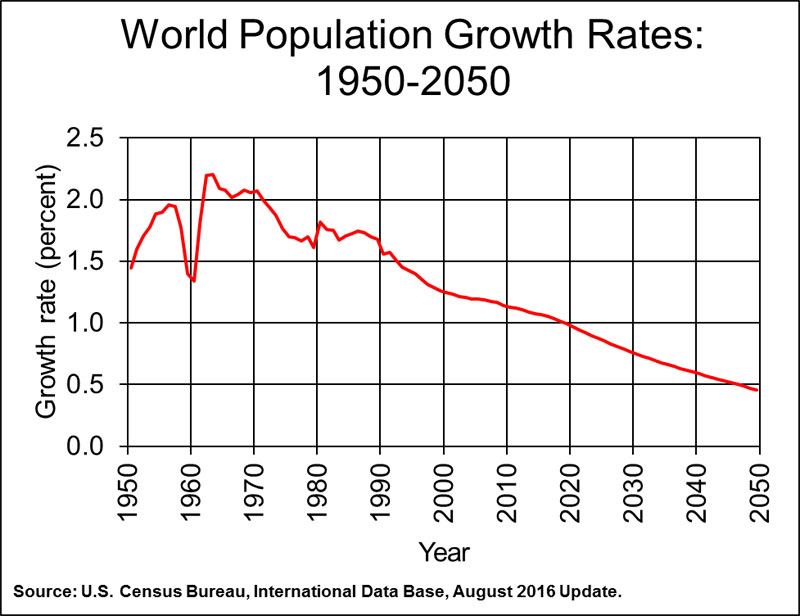
Our growth rate has also fallen significantly, as this chart from the US Census Bureau shows.
Annual population increase likewise has improved from a high of 87 million in 1989 to around 78 million in 2016.
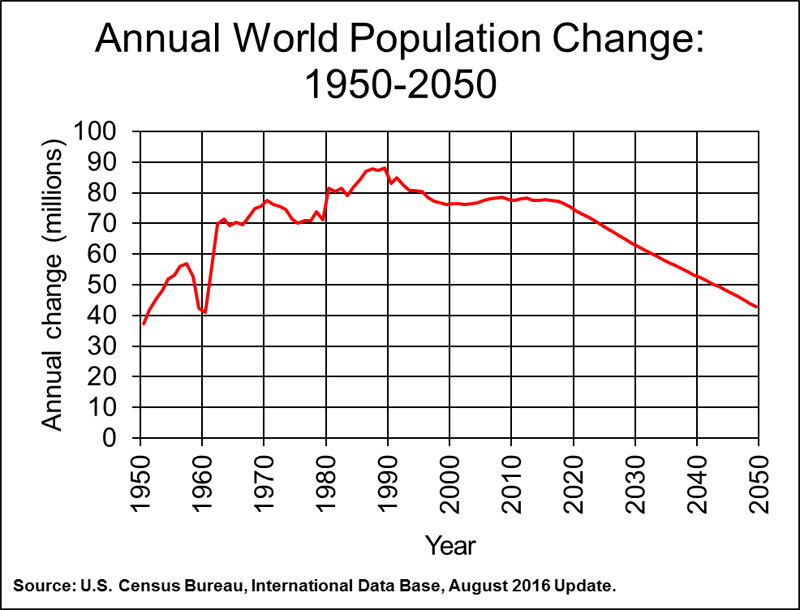
However, before we pop a cork to celebrate the fizzle of our population
explosion, there’s one more chart—one most often ignored or discounted.
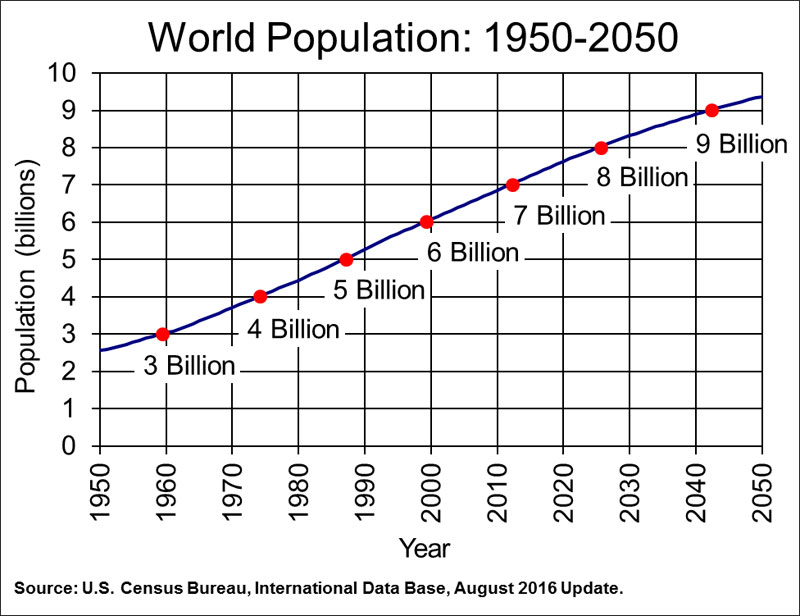
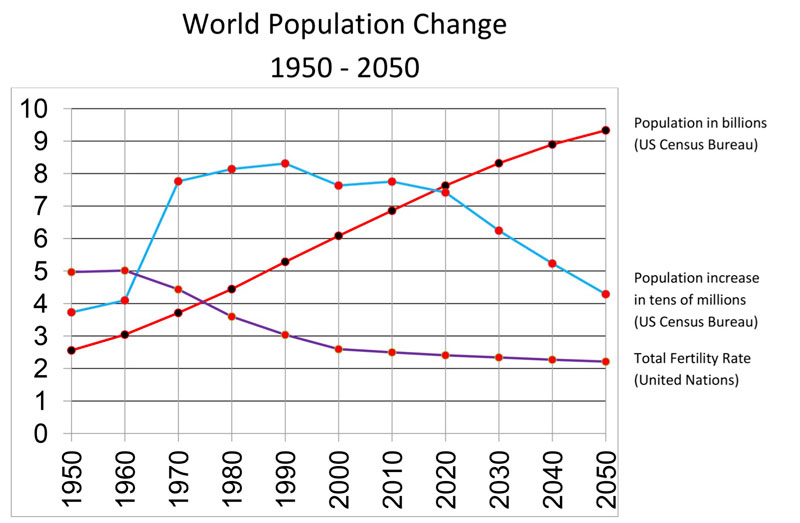
Compare our population added, Total Fertility Rate, and population size over one century.
Q: With birth rates, fertility rates, and growth rates all falling, how can our population keep on steadily rising?
Momentum. Although couples are creating fewer of us, there are more couples creating those new people, which makes more of us. For example, China’s 1.5 Total Fertility Rate is way below “replacement level fertility,” and yet their natural increase is 5.9 million per year (2016 estimate—down from 8.8 in 2010). Growth was projected to continue until 2030, 50 years after implementing their one-child policy. Their new two-child policy is likely to increase birth rates, at least temporarily, pushing their zero growth year beyond 2030.
This serves as an ominous warning. If cutting fertility rates in half hasn’t stopped our increase, what will it take? How much better can we expect birth rates to get? Improving global fertility from five to two and a half was easy, with improved reproductive health services. Further improvement will require inceased reproductive freedom and responsibility. Many countries have stalled at a plateau and aren’t likely to go any lower unless conditions change.
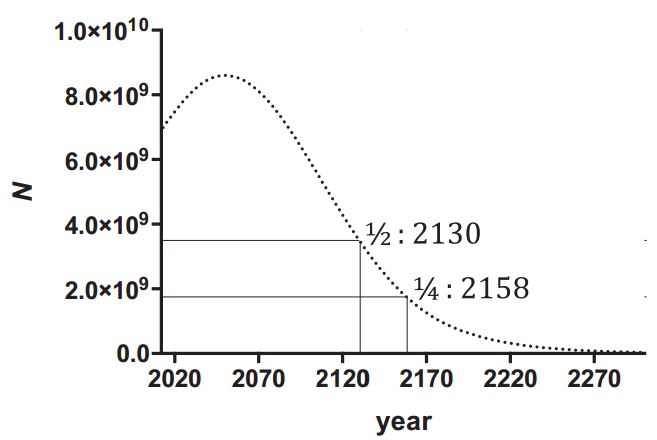
A 2014 computer projection of a global one-child average fertility rate projects approximately five billion of us in 2100 due to this momentum.
A note on the first two charts above: dip in growth rate from 1959-1960 was
due to the Great Leap Forward in China. Natural disasters and decreased
agricultural output following massive social reorganization caused
China’s death rate to increase greatly and fertility rate to fall by almost half. This tragic loss of human life—an estimated 30 million died—wasn’t enough to cause a ripple in chart three above. Increasing deaths has proved ineffective for improving global population density.
“Falling
Fertility” The Economist October 29, 2009
Analysis of “Population growth is not the problem” perspective.
Demographic entrapment caused by stalled TFR improvement.
Q: If we only produce two children, doesn’t that just replace ourselves?
“Stop at two” may have seemed like a radical proclamation when Zero Population Growth was founded in 1968, but it was barely adequate even then. So-called replacement level fertility of 2.1 offspring per couple wouldn’t bring about true zero population growth until the end of this century, if then.
Today the message from population-awareness organizations is only slightly revised: “Consider having none or one, and be sure to stop after two.”
The notion that producing two descendants simply replaces a couple and creates no increased impact is specious. We aren’t salmon—we don’t spawn and die. Most of us will be around to see our progeny beget, and those begotten beget to boot.
When a couple of us “replaces” ourselves, our environmental impact doubles—assuming our offsprings’ lifestyles are as environmentally friendly as ours, and that they won’t reproduce themselves.
The “stop at two” message actually encourages reproduction by “qualified” couples. Although a wanted child is better than unwanted, intelligent (whatever that is) better than stupid, and well-cared-for better than neglected, each of us in the over-industrialized world has a huge impact on Nature, regardless of these factors.
For example, when a North American couple stops at two, due to our larger ecological footprint, it’s about the same as an average East Indian couple stopping at 15, or a Bangaledesh couple stopping at 20.
Two is better than four, and one is twice as good as two, but to purposely set out to create even one more of us today is the moral equivalent of selling berths on a sinking ship.
Regardless of how many progeny we have or haven’t produced, rather than stop at two, we must stop at once.
Q: Will lower Infant Mortality Rates cause lower Total Fertility Rates?
Maybe, the statistics aren’t conclusive.
Bill Gates of The Gates Foundation expresses conventional wisdom to support their vaccination efforts: “Parents choose to have enough kids to give them a high chance that several will survive to support them as they grow old. As the number of kids who survive to adulthood goes up, parents can achieve this goal without having as many children.”
Parents are better able to provide for their children when they have fewer of them, which means more will survive, so fertility directly influences child mortality.
Sub-Saharan Africa’s fertility rates could remain high because infant mortality remains high, and infant mortality could be high because of high fertility rates. In this region, other factors such as cultural preference for large families, gender inequality and the subsequent lack of reproductive freedom, may influence fertility more than infant survival does.
In some cases, lower infant mortality and lower birth rates may be two results of other factors, such as improved reproductive health care, rather than one causing the other.
Allowing women to determine how many offspring they produce would reduce child mortality more effectively than vaccines, but vaccinations enjoy wider acceptance than gender equality.
Hans Rosling demonstrates how lower infant mortality, and higher standards of living, bring about lower fertility rates. Analysis of this demonstration. Analysis of another Hans Rosling talk.
Animated graph charting selected countries’ child mortality and total fertility over time. With a few viewings, we might discern whether fewer child deaths seem to cause lower fertility or lower fertility seems to cause fewer child deaths.
Q: When will human population stop increasing?
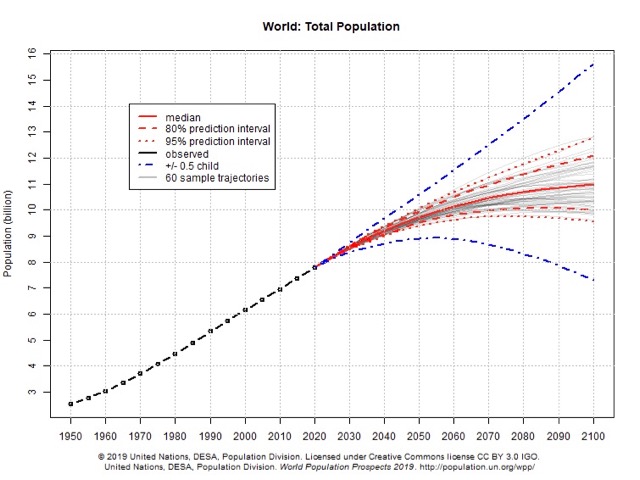
Projections are not predictions, so they are constantly updated as more and better data become available. If present fertility rates remained constant, we would number nearly 27 billion by 2100. No one expects this impossible number, thanks to many factors influencing fertility and mortality rates. Differences in population projections result from choosing which factors are used and how much weight each is given. Converting reality into numbers requires demographers to limit factors or it gets too complicated and over budget. Politics can play a role as controversial factors such as global climate disruption, peak oil, and economic collapse are ignored.
Although given little consideration in projections now, environmental constraints could become critical factors as we increasingly exceed Earth’s diminishing carrying capacity for our kind.
Global economic dynamics also play an increasing role in local carrying capacity. For example, Africa’s population is projected to quadruple from 1.1 billion to 4.2 billion by 2100. However, foreign resource extraction and purchase of farmland for export crops already constrains inadequate efforts to support existing people. Improving birth rates by providing reproductive health services and encouraging responsible choices would be child’s play compared with finding food and water for four times as many people.
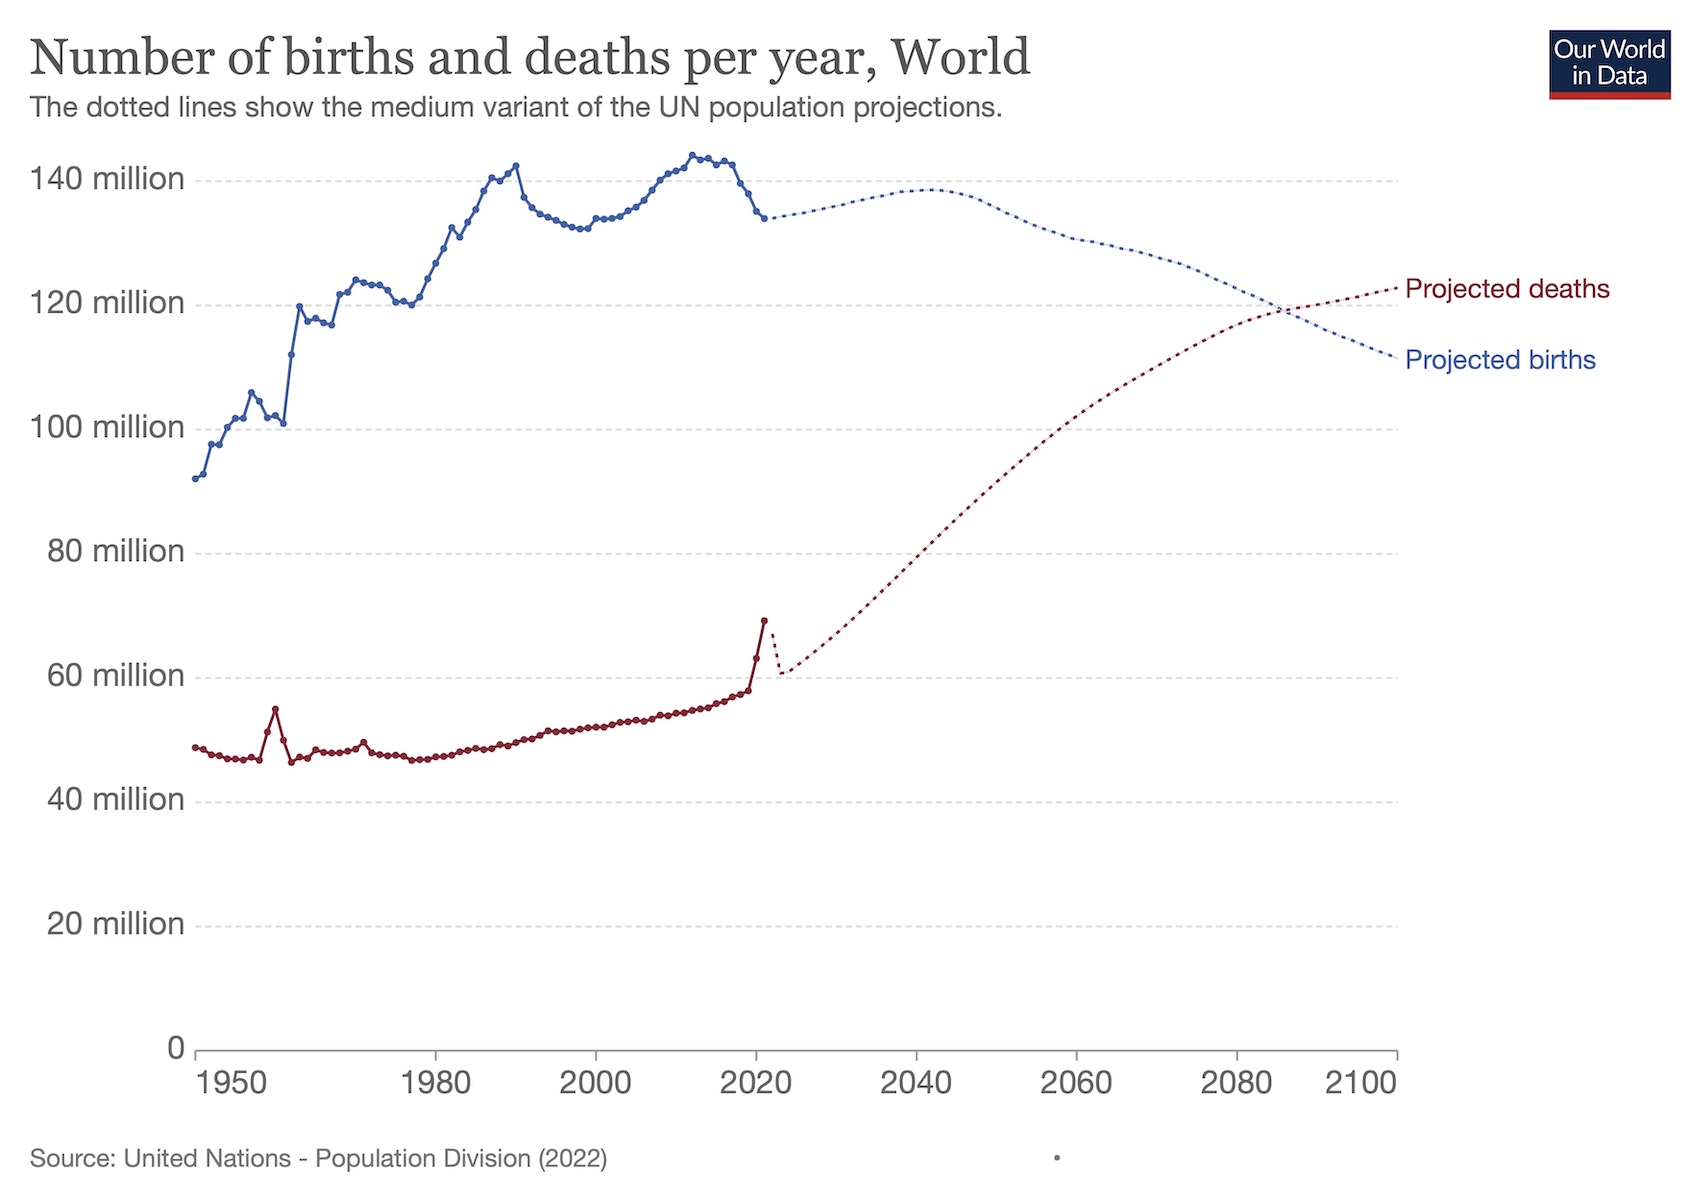
Our population density will begin to improve when more of us die than are born. This could come from either an increase in deaths or a decrease in births.
Sites with demographic information
Debunking the “Overpopulation is a Myth” video series:
Episode One: “The Making of a Myth”
Episode Two: “2.1 TFR = Stable Population”
Episode Three: “Food: There’s Lots of It”
Episode Four: “Poverty: Where We All Started”
Episode Five: “7 Billion People: Will Everyone Please Relax?”
